
Microsoft has just announced the general availability (GA) of the integration of Power BI with PowerPoint. I have previously blogged about this feature here => Power BI Live Embedding. With the recent GA announcement comes a significant improvement over the public preview version.
Power BI Single Visual Embedding in PowerPoint
Embedding of full report pages was available with the public preview. With this GA release, it is now possible embed single visuals from any report as separate interactive objects in your PowerPoint document. This works with reports from a shared workspace as well as reports from “My Workspace”. This is very exciting because it means that people can take single charts from Power BI, embed them in their PowerPoint presentations (with a live connection) and add commentary as required. See example below.

As covered in my earlier article linked above, such charts are fully interactive directly inside PowerPoint. You can zoom, filter, hover, select, or whatever you need to do to illustrate your point during the presentation. If necessary, you can click the hyperlink (bottom left corner) and launch directly into Power BI for a more detailed analysis. I can see practical uses in many areas.
Use Case 1: Business Reviews
In my time working at Coca-Cola, it was common to produce business review presentations for customers. Communicating their performance versus some prior period, vs budget, etc. With this new integration it will be possible to build a review presentation template with live links to the charts needed to build the presentation. Each time you have to present new data, simply duplicate the PowerPoint file to a new version and update it for the new reporting period. The business manager just needs to edit the commentary for the new version of the file as required.
Use Case 2: Financial Reporting with Commentary
Another common scenario I can see adding value is monthly financial reporting with commentary. Being able to embed standard charts which automatically show the latest data then add comments (which persist and don’t change) will surely save a lot of time.
Persistence of Data
One thing I realised when reviewing this capability is that the data can change between creation of the presentation and when you get to share it. Sometimes that is what you want, sometimes it wont be what you want. There is a Filter pane that comes with each embedded visual (see image). It is possible to place filters on your visuals to limit the range of data that will be displayed. These filters are independent of any filters that exist in the Power BI service.

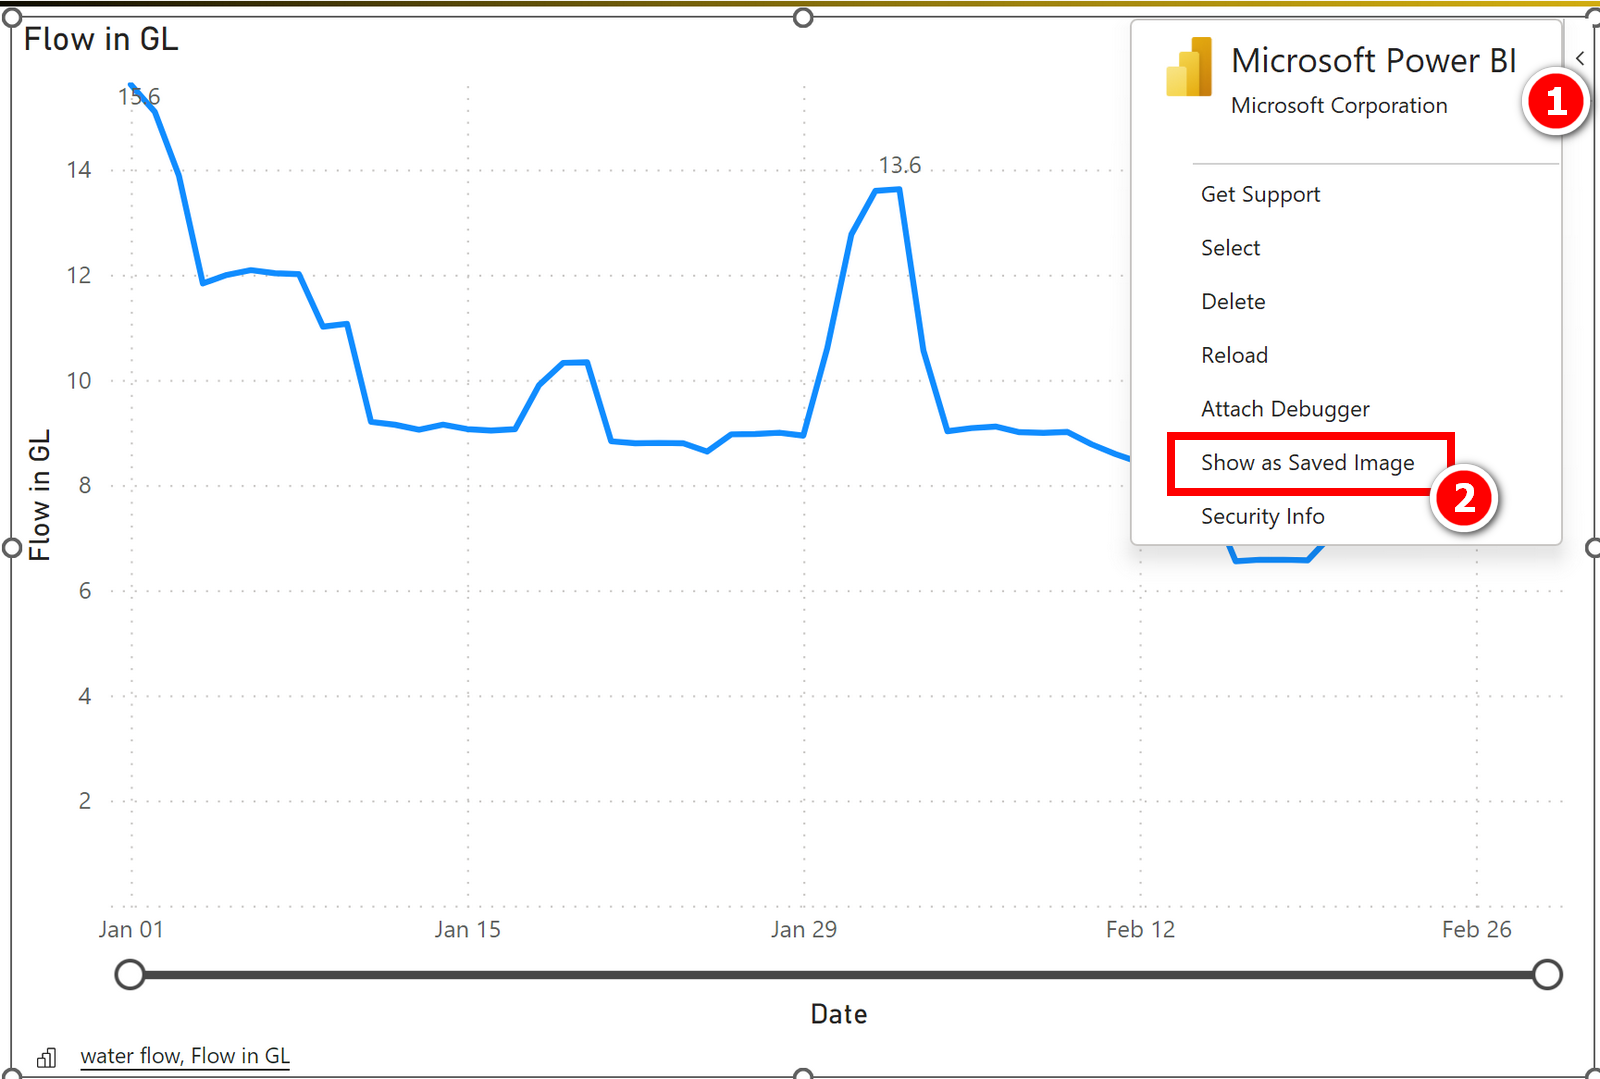
It is also possible to set the embedded visual to present as an image. You can find this setting in the menu at the top right of the frame (#1 below). You can set this to save as an image to persist the data as presented on the day. If you want to interact with the report during the presentation, simply toggle this setting again.
How to Add a Single Visual to a PowerPoint Presentation
The process of inserting a single visual into PowerPoint is very easy. Simply go to your Power BI report in the Power BI service, right click on the more options ellipsis #1 in the top right corner of the visual and select #2 Share, #3 Open in PowerPoint (probably not a good menu name but that is what it is called at this writing).

From there you can copy the embed code needed for the single visual.
Then switch to PowerPoint and navigate to Insert\Power BI. During the public preview it was a requirement for you to manually install a PowerPoint Add-In, first. Some on older versions of PowerPoint may still need you to do this. Refer to my original post linked at the top of this page if you can’t see the Power BI option on your Insert Ribbon inside PowerPoint.

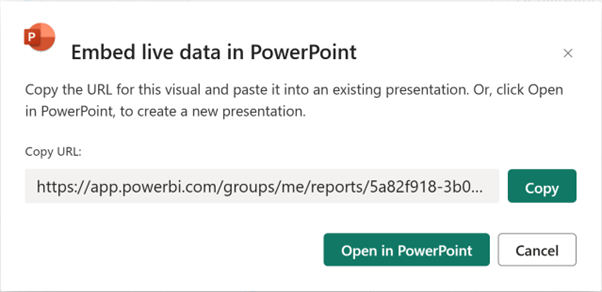
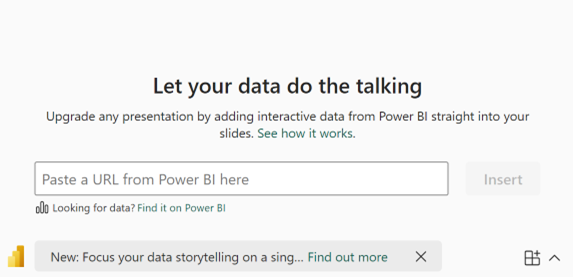
This will then create a placeholder in your PowerPoint presentation. Paste the URL in the space shown.
A Word of Caution
Having a live link to the data is a strength and a weakness. If you are not filtering your data and want to keep a permanent record of what was in your presentation at a point it time, it may be a good idea to save a PDF version for later reference.
Full Documentation
There is a lot more to this than I have covered in this article. You can find full documentation of this feature here https://learn.microsoft.com/en-us/power-bi/collaborate-share/service-power-bi-powerpoint-add-in-view-present#freeze-the-current-view
What Other Users Can You Imagine?
I would love to hear in the comments any other ideas on how to use this feature and what you think of it.